VECTIQ
← Computer Vision & Camera AI

Construction & Infrastructure AI

A construction site already has cameras, and most of what they record is never looked at. We put that footage to work: each snapshot is segmented into the main elements visible on site (earthworks, structure, facade, scaffolding, finishes) by a general segmentation model we are adapting to construction, checked for safety violations and counted for workers, then rolled up into progress per phase against the planned S-curve, with the estimate calibrated per project. The archive becomes timelapse video and PDF reports without anyone sorting photos. For finished structures such as bridges and high-rise buildings, a second pipeline takes drone imagery, finds and measures defects in millimetres and grades their severity; rebuilding the structure in 3D and following each defect from one inspection to the next are the next steps.

Construction & InfrastructureEnterpriseSmart City & Transport
Construction & Infrastructure AI

Technical capabilities

01

Site Segmentation

A general-purpose SegFormer model, being adapted to construction, segments each site image into the main visible elements - earthworks, structure, facade, scaffolding, finishes. The area share of each is stored per image as a time series.

02

Progress Against Plan

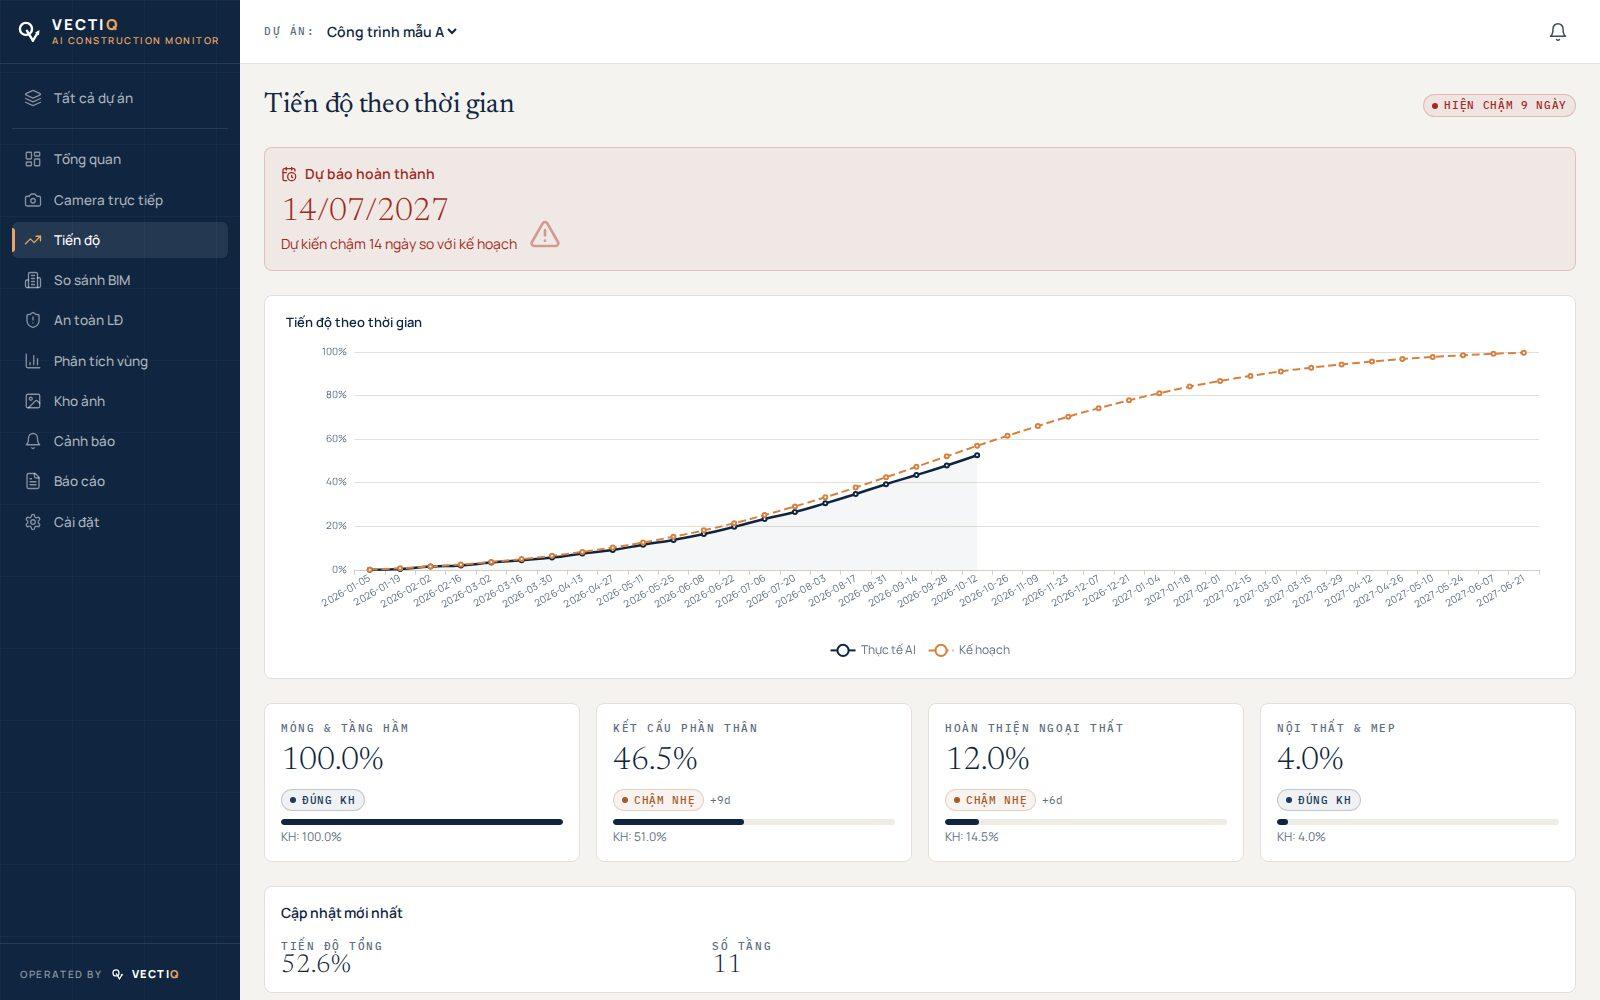
Class areas are mapped to foundation, structure, facade and interior with weights calibrated per project, compared with the planned schedule and drawn as an S-curve with delay in days and a completion forecast. A project manager can override any figure, and the override is kept as such.

03

Safety Violation Detection

YOLOv8 flags missing hardhats and vests, people inside danger zones defined per camera, people close to machinery and lone workers. High-severity events reach the dashboard in real time and Telegram.

04

Worker Counting

Each processed image is counted for people, whether or not a violation was found, so the site gets a daily manpower curve and a peak figure per day.

05

Timelapse & Reports

Pick a camera, a date range and a frame rate and the archive becomes an MP4 timelapse. PDF reports combine progress, safety and site photos, with an optional written summary in Vietnamese or English.

06

Drone Defect Detection

A YOLOv8 segmentation model finds cracks, corrosion, spalling, deformation and missing bolts; ground sample distance turns pixel masks into length, width and area in millimetres.

07

Severity & Health Index

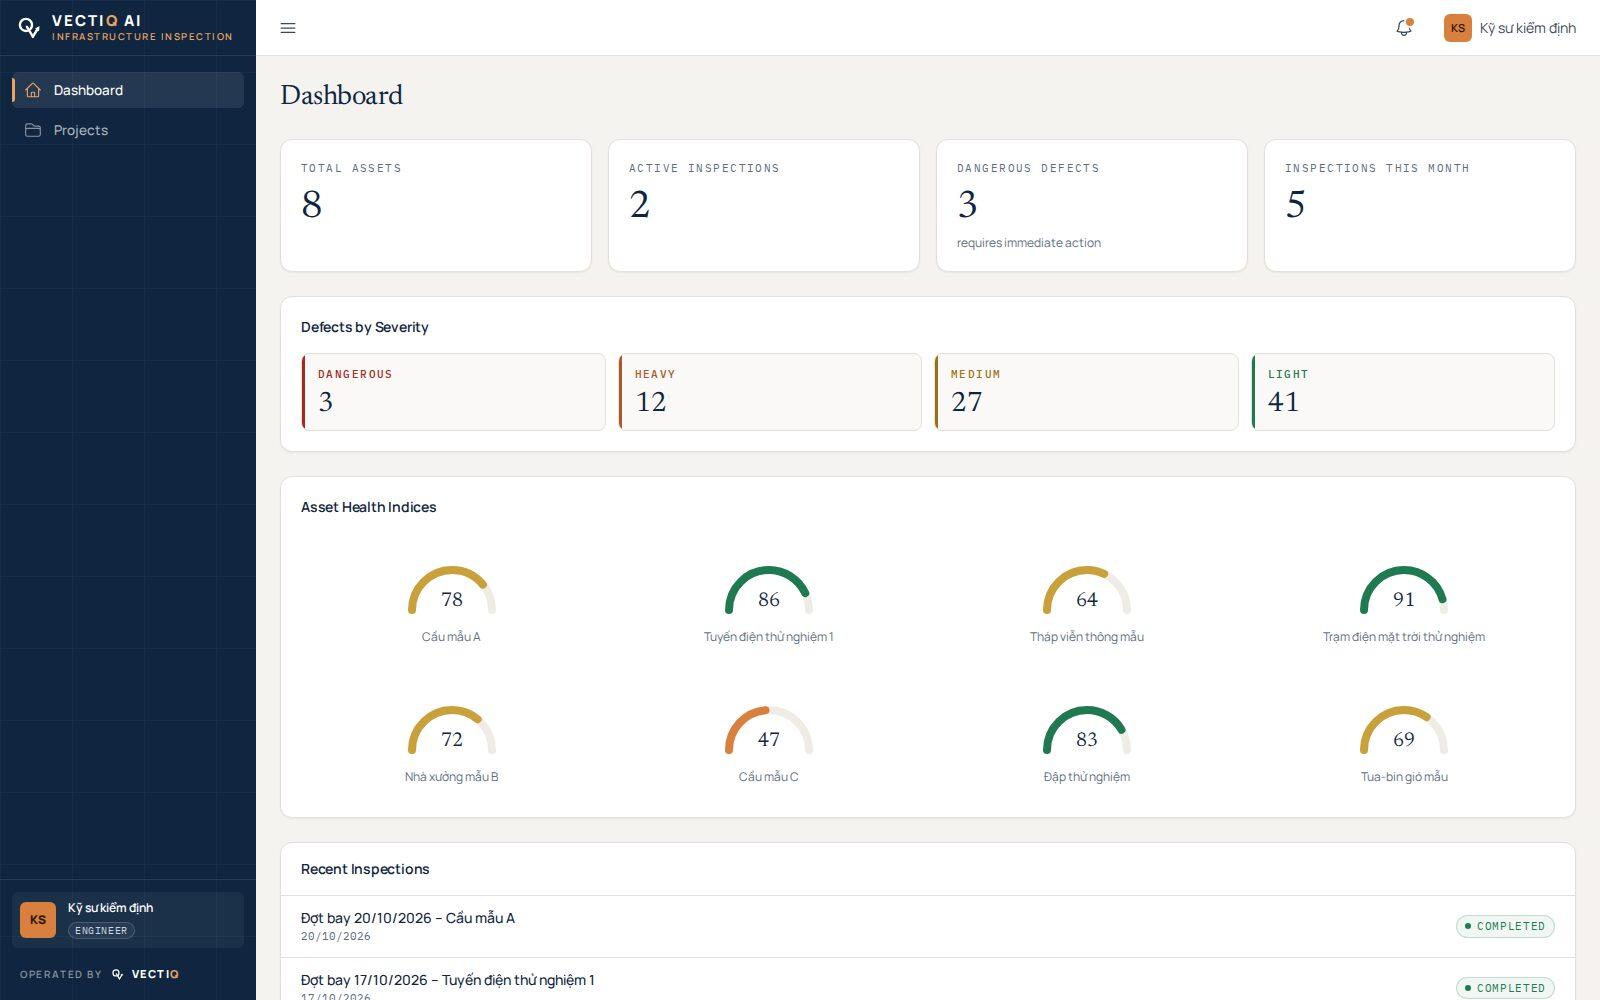
EfficientNet-B2 grades each defect as light, medium, heavy or dangerous. The grades roll up into a 0-100 health index per asset, so a bridge has one number to watch between inspections.

08

3D Model & Defect History (Roadmap)

Next steps: rebuild the structure from the flight as a point cloud and mesh you can orbit in the browser, place each defect on that model, and match defects with those found in earlier inspections, so a crack has a history instead of a new ID every time.
Processing pipeline

01

Site Cameras & Drones

Timelapse / EXIF-GPS

02

Ingest & Storage

Webhook / MinIO

03

Job Queue

RabbitMQ / Celery

04

Vision Models

SegFormer / YOLOv8

05

Progress & Health

TimescaleDB / S-curve

06

Dashboard & Reports

React / PDF

Deployment scenarios

General Contractors

Progress Without Walking the Site

The site manager usually learns about a slipping phase at the weekly meeting. With cameras feeding the system, the S-curve updates from the images themselves: which phase is behind, by how many days, and when the work will finish at the current pace.

  • Progress per phase from segmented site images
  • S-curve of actual against planned with delay in days
  • Completion forecast from recent pace
  • Manual override when the site knows better than the camera
  • Camera health flags for blurred, dark or blocked views
SegFormerS-curveTimescaleDBForecast
Site Safety (HSE)

Safety Checks From Site Snapshots

A safety officer cannot stand at every scaffold. Images from the cameras are checked for PPE, danger zones and people near machinery; serious cases go straight to the officer's phone, and each event waits in a list until someone marks it handled.

  • Missing hardhat and safety vest detection
  • Danger-zone polygons defined per camera
  • Person-near-machinery and lone-worker warnings
  • Real-time alerts on the dashboard and Telegram
  • Acknowledge workflow and safety trend charts
YOLOv8PPEDanger ZoneSocket.IO
Owners & Project Management Offices

Several Sites, One Portfolio View

An owner running several projects needs to see which one is slipping without reading every contractor's report. The portfolio view lists each project's progress, open alerts and peak headcount; timelapse and PDF reports carry the evidence to the board meeting.

  • Portfolio summary across projects
  • Image archive filtered by camera and date
  • Timelapse video generated from the archive
  • PDF report with progress, safety and site photos
PortfolioTimelapsePDF ReportDashboard
Bridges & High-rise Buildings

Drone Inspection, Measured and Graded

Rope access and a lift truck cost days per inspection, and the result is a stack of photos that nobody compares with last year's. A drone flight goes through the pipeline instead: defects found and measured, severity graded, uncertain cases sent to an engineer, and the result exported as a report. Rebuilding the structure in 3D and linking each defect to what was seen last time are on the roadmap.

  • Crack, corrosion, spalling, deformation and missing-bolt detection
  • Defect size in millimetres from ground sample distance
  • Four-level severity grading and an asset health index
  • PDF and Excel inspection reports
  • Engineer review of uncertain detections, kept for retraining
DroneYOLOv8-segEfficientNetEngineer Review

Tech stack

SegFormerYOLOv8EfficientNet-B2OpenSfMOpen3DFastAPIRabbitMQCeleryTimescaleDBMinIOReactThree.js

Related projects