Drone Infrastructure Inspection
Drone imagery of bridges and high-rise buildings in, defects out: detected, measured in millimetres and graded by severity, with 3D reconstruction and tracking across inspections on the roadmap
Overview
An inspection starts with a set of drone photos uploaded against an asset, a bridge or a high-rise building. A Celery chain then does the work in order. Preprocessing reads EXIF and GPS, rejects blurred frames and cuts each photo into overlapping 1024-pixel tiles so thin cracks are not lost when the image is resized.
A YOLOv8 segmentation model, exported to ONNX, finds cracks, corrosion, spalling, deformation and missing bolts; the ground sample distance converts each mask to length, width and area in millimetres. An EfficientNet-B2 classifier grades each defect as light, medium, heavy or dangerous, and detections the model is unsure about are flagged for an engineer, whose corrections are stored for the next round of training.
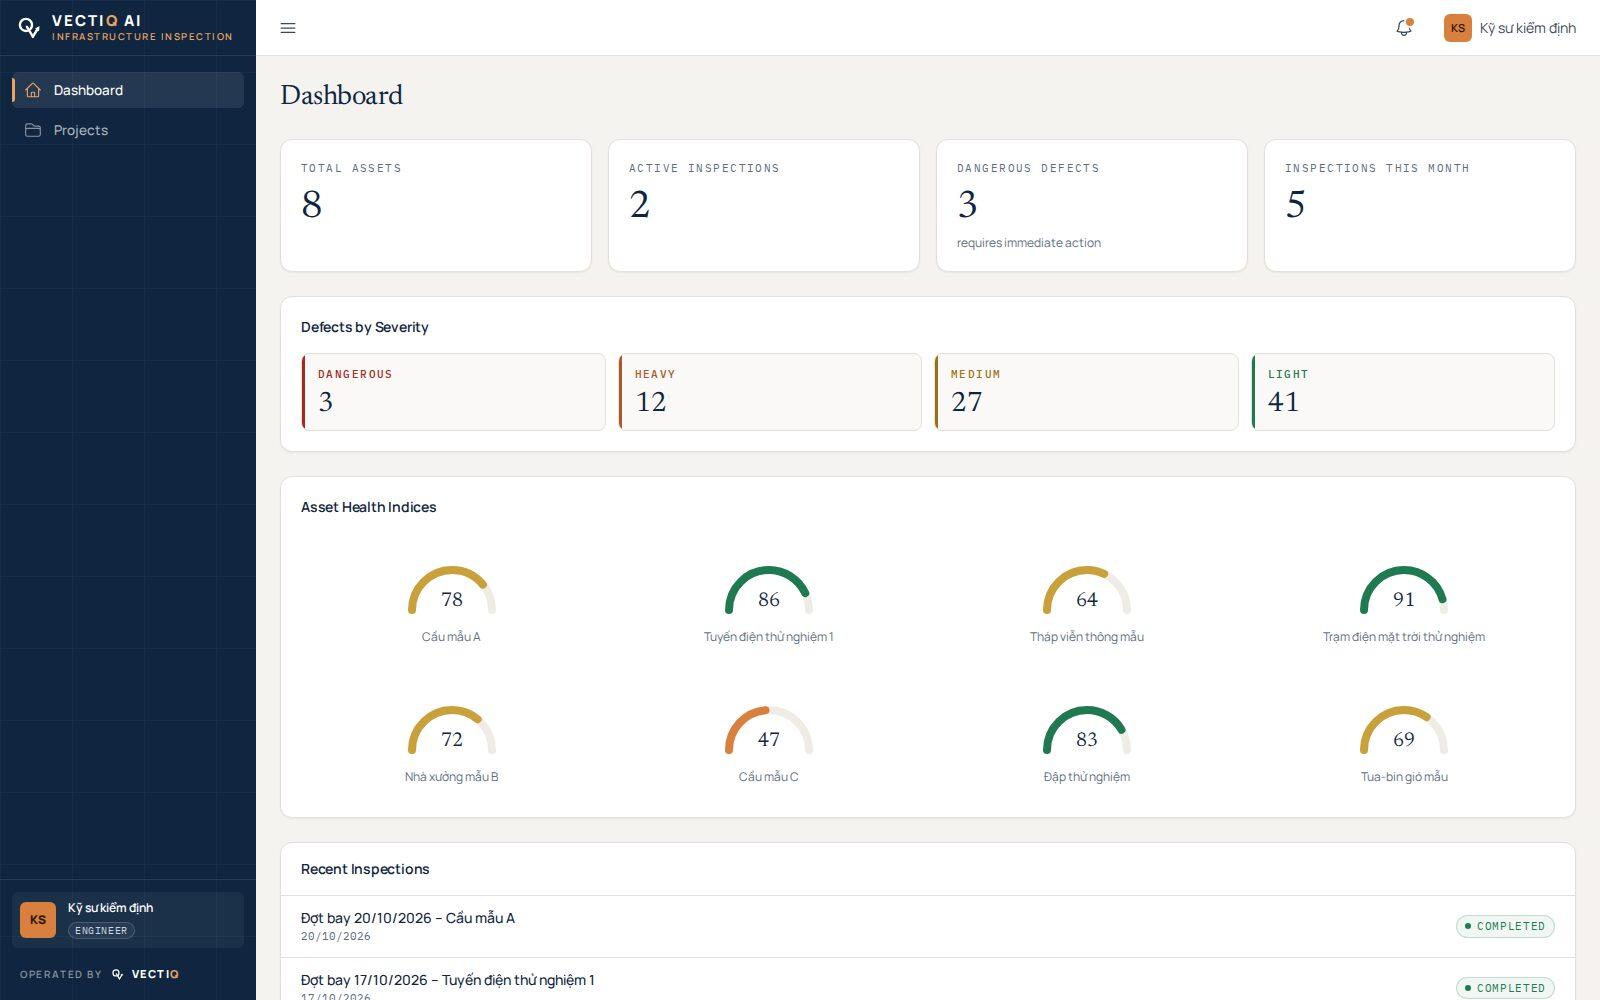
The asset health index is then recomputed, and email alerts and signed webhooks go out. Reports export to PDF and Excel. The pipeline, training scripts and Kubernetes manifests are in place; the defect models still need training on inspection data.
The next steps are rebuilding the structure as a point cloud and mesh with OpenSfM and Open3D for a browser 3D viewer, placing each defect on that model, and linking defects across inspections to measure crack growth.